Xc Title
User:Guest
UK Airsports advert
Artur Leskiewicz  All flights
National League 2016
Flight type image
Turnpoint Flight on a Paraglider
Club
Grupa 303
Glider
Advance Iota 26
Date
25th March 2016
Start
10:45
Finish
12:39
Duration
1hr 54mins
Takeoff
Combe Gibbet
Landing
Nr Andover Down
Coords
Takeoff
51.35865, -1.48025
Start
51.35902, -1.47978
TP1
51.34773, -1.49377
TP2
51.36390, -1.48105
TP3
51.35787, -1.49948
Finish
51.21548, -1.40797
Landing
51.21550, -1.40793
Distances and Score
Leg 1
1.59k
Leg 2
2.01k
Leg 3
1.45k
Leg 4
17.08k
Total
22.13k
Score
22.1
Open Distance
Total
17.3k
Filename
Use full pilot name
Download
Validated
Yes
Flight map
Notes

This map gives an overview of the flight, using the turnpoints to plot the track.

Use the for a detailed map and flight track.

Duration 0:00   Takeoff Distance 0
Controls
To animate the flight: click a point on the track, use the slider, or click the Play button.
slider
slider
Speed
Speed
Slower
Faster
Track color
No data
Highlights
Track data
Time: No data
Height:
Climb:
Speed:
Interval:
Units
Height: metres
Climb: m/sec
Speed: km/h
Distance: km
chart
Notes

Climb and Speed averaged over 4 second intervals.

These values may be lower than those shown by a flight instrument, which has access to continuous raw data.

Metric units are used for all chart data, except for Height which is shown in feet.

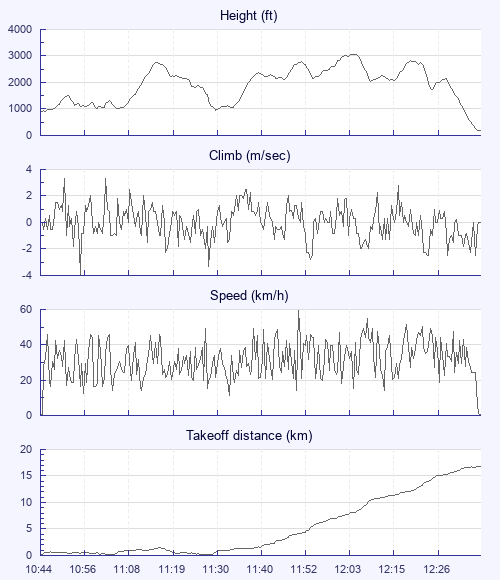
Height   -   Pressure data
Maximum Height
[12:06:41]
3068 ft
Lowest Save
[11:31:02]
958 ft
Takeoff Height
[10:44:40]
863 ft
Landing Height
[12:40:02]
174 ft
Total Ascent 10761 ft
Height Gain
Above Takeoff 2205 ft
Units
Climb   -   Pressure data
Maximum Climb
[10:51:51]
3.3 m/s
Minimum Climb
[10:55:49]
-4.0 m/s
Units
Speed
Maximum Speed
[11:52:13]
59.4 km/h
Average Speed
around course
11.6 km/h
Average Speed
over track length
30.9 km/h
Units
Tracklog
Flight Duration 1hr 55mins
Track Points 3390
Recording Interval 2 secs
Statistics Interval 4 secs
Track Length 59.4 km
Units
Flight instrument
Type Brauniger
Model Competino+
Firmware 3.10p
Notes

Climb and Speed averaged over 4 second intervals.

These values may be lower than those shown by a flight instrument, which has access to continuous raw data.

Average Speed around course is measured from Start to Finish points.

Track Length is the cumulative distance between track points from Takeoff to Landing.

You can change the default units displayed - see the Options page.

Use this page to set various display Options. You can choose which units are used to display flight data, which map to show when the starts and which tab to show each time you view a flight.
Units settings

Metric units are used by default for the Statistics and XC Player pages, except for Height data which is shown in feet. You can choose your own custom settings here.

Height:
Speed:
Climb:
Distance:
  Use default
XC Player settings

When the XC Player starts, the track data is shown on the Hybrid map. You can choose a different map here.

Main Map:
  Use default
Tab settings

The first tab shown when you view a flight is the Flight Map. You can choose a different tab here.

First Tab:
  Use default
Notes

This page uses cookies to save your settings for future visits.

If you have disabled cookies for this site then any changes you make will not be saved.