Xc Title
User:Guest
Cloudbase Paragliding advert
Mark Gravestock  All flights
National League 2016
Flight type image
Turnpoint Flight on a Paraglider
Club
Cumbria
Glider
Advance Iota
Date
8th October 2016
Start
13:57
Finish
15:26
Duration
1hr 29mins
Takeoff
Carrock Fell
Landing
Nr Castlerigg
Coords
Takeoff
54.69707, -3.01667
Start
54.69265, -3.01288
TP1
54.71335, -3.00613
TP2
54.64082, -2.99458
TP3
54.58285, -3.09907
Finish
54.59215, -3.10800
Landing
54.59210, -3.10767
Distances and Score
Leg 1
2.35k
Leg 2
8.11k
Leg 3
9.34k
Leg 4
1.19k
Total
20.99k
Score
21.0
Open Distance
Total
15.8k
Filename
Use full pilot name
Download
Validated
Yes
Flight map
Notes

This map gives an overview of the flight, using the turnpoints to plot the track.

Use the for a detailed map and flight track.

Duration 0:00   Takeoff Distance 0
Controls
To animate the flight: click a point on the track, use the slider, or click the Play button.
slider
slider
Speed
Speed
Slower
Faster
Track color
No data
Highlights
Track data
Time: No data
Height:
Climb:
Speed:
Interval:
Units
Height: metres
Climb: m/sec
Speed: km/h
Distance: km
chart
Notes

Climb and Speed averaged over 5 second intervals.

These values may be lower than those shown by a flight instrument, which has access to continuous raw data.

Metric units are used for all chart data, except for Height which is shown in feet.

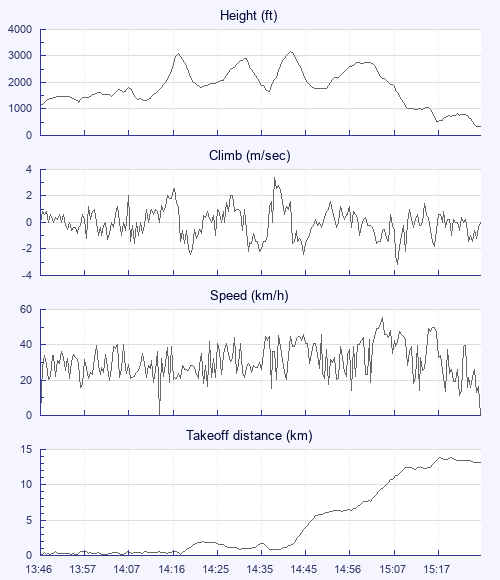
Height   -   Pressure data
Maximum Height
[14:41:21]
3159 ft
Lowest Save
[14:10:29]
1302 ft
Takeoff Height
[13:46:09]
1132 ft
Landing Height
[15:27:13]
325 ft
Total Ascent 7949 ft
Height Gain
Above Takeoff 2028 ft
Units
Climb   -   Pressure data
Maximum Climb
[14:37:51]
3.4 m/s
Minimum Climb
[15:07:38]
-3.2 m/s
Units
Speed
Maximum Speed
[15:04:17]
55.4 km/h
Average Speed
around course
14.1 km/h
Average Speed
over track length
31.0 km/h
Units
Tracklog
Flight Duration 1hr 41mins
Track Points 1301
Recording Interval 5 secs
Statistics Interval 5 secs
Track Length 52.2 km
Units
Flight instrument
Type Lk8000 Kobo
Model Not Set
Firmware 6.0a
Notes

Climb and Speed averaged over 5 second intervals.

These values may be lower than those shown by a flight instrument, which has access to continuous raw data.

Average Speed around course is measured from Start to Finish points.

Track Length is the cumulative distance between track points from Takeoff to Landing.

You can change the default units displayed - see the Options page.

Use this page to set various display Options. You can choose which units are used to display flight data, which map to show when the starts and which tab to show each time you view a flight.
Units settings

Metric units are used by default for the Statistics and XC Player pages, except for Height data which is shown in feet. You can choose your own custom settings here.

Height:
Speed:
Climb:
Distance:
  Use default
XC Player settings

When the XC Player starts, the track data is shown on the Hybrid map. You can choose a different map here.

Main Map:
  Use default
Tab settings

The first tab shown when you view a flight is the Flight Map. You can choose a different tab here.

First Tab:
  Use default
Notes

This page uses cookies to save your settings for future visits.

If you have disabled cookies for this site then any changes you make will not be saved.