Xc Title
User:Guest
UK Airsports advert
Lauren Martins  All flights
Thames Valley League 2016
Flight type image
FAI Triangle on a Paraglider
Club
XC Junkies
Glider
Ozone Enzo 2
Date
14th August 2016
Start
15:06
Finish
17:27
Duration
2hrs 21mins
Takeoff
Combe Gibbet
Coords
Takeoff
51.35875, -1.48312
Start
51.35850, -1.48017
TP1
51.34058, -1.42867
TP2
51.39205, -1.32992
TP3
51.39575, -1.51280
Finish
51.35850, -1.48017
Landing
51.35875, -1.47850
Distances and Score
Leg 1
8.49k
Leg 2
8.95k
Leg 3
12.74k
Total
30.18k
Multiplier
x 2.30
Score
69.4
Open Distance
Total
12.7k
Filename
Use full pilot name
Download
Validated
Yes
Flight map
Notes

This map gives an overview of the flight, using the turnpoints to plot the track.

Use the for a detailed map and flight track.

Duration 0:00   Takeoff Distance 0
Controls
To animate the flight: click a point on the track, use the slider, or click the Play button.
slider
slider
Speed
Speed
Slower
Faster
Track color
No data
Highlights
Track data
Time: No data
Height:
Climb:
Speed:
Interval:
Units
Height: metres
Climb: m/sec
Speed: km/h
Distance: km
chart
Notes

Climb and Speed averaged over 4 second intervals.

These values may be lower than those shown by a flight instrument, which has access to continuous raw data.

Metric units are used for all chart data, except for Height which is shown in feet.

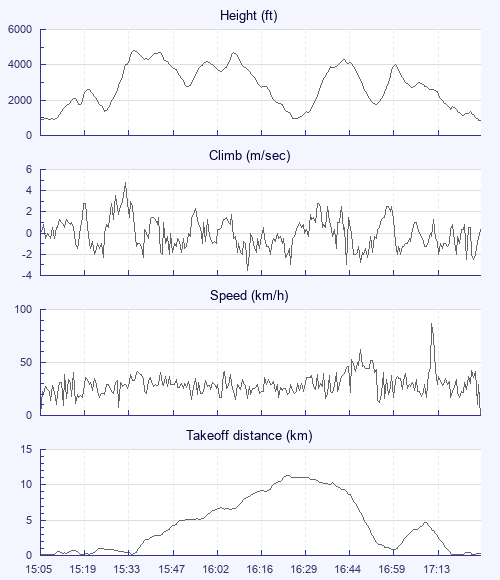
Height   -   Pressure data
Maximum Height
[15:35:56]
4826 ft
Lowest Save
[16:27:48]
942 ft
Takeoff Height
[15:05:04]
840 ft
Landing Height
[17:29:36]
866 ft
Total Ascent 16263 ft
Height Gain
Above Takeoff 3986 ft
Maximum 3993 ft
Low Point
[15:05:20]
833 ft
High Point
as Maximum Height
4826 ft
Units
Climb   -   Pressure data
Maximum Climb
[15:33:48]
4.8 m/s
Minimum Climb
[16:13:16]
-3.5 m/s
Units
Speed
Maximum Speed
[17:13:44]
86.4 km/h
Average Speed
around course
12.8 km/h
Average Speed
over track length
28.8 km/h
Units
Tracklog
Flight Duration 2hrs 24mins
Track Points 2169
Recording Interval 4 secs
Statistics Interval 4 secs
Track Length 69.4 km
Units
Flight instrument   -   reported as
XC Trainer V3.5-11, S/N 124
Notes

Climb and Speed averaged over 4 second intervals.

These values may be lower than those shown by a flight instrument, which has access to continuous raw data.

Average Speed around course is measured from Start to Finish points.

Track Length is the cumulative distance between track points from Takeoff to Landing.

You can change the default units displayed - see the Options page.

Use this page to set various display Options. You can choose which units are used to display flight data, which map to show when the starts and which tab to show each time you view a flight.
Units settings

Metric units are used by default for the Statistics and XC Player pages, except for Height data which is shown in feet. You can choose your own custom settings here.

Height:
Speed:
Climb:
Distance:
  Use default
XC Player settings

When the XC Player starts, the track data is shown on the Hybrid map. You can choose a different map here.

Main Map:
  Use default
Tab settings

The first tab shown when you view a flight is the Flight Map. You can choose a different tab here.

First Tab:
  Use default
Notes

This page uses cookies to save your settings for future visits.

If you have disabled cookies for this site then any changes you make will not be saved.