


| Duration | 0:00 | Takeoff Distance | 0 |
| Height: | metres |
| Climb: | m/sec |
| Speed: | km/h |
| Distance: | km |
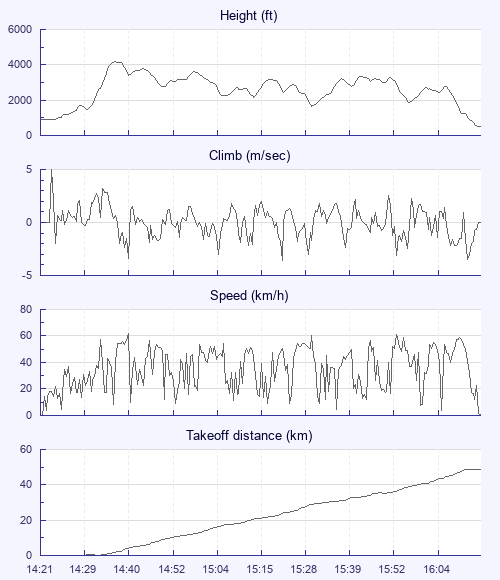
| Height - GPS data | |
| Maximum Height [14:37:40] |
4173 ft |
| Lowest Save [15:31:40] |
1637 ft |
| Takeoff Height [14:21:45] |
906 ft |
| Landing Height [16:18:11] |
502 ft |
| Total Ascent | 11699 ft |
| Height Gain | |
| Above Takeoff | 3268 ft |
| Units | |
| Climb - Pressure data | |
| Maximum Climb [14:22:02] |
5.0 m/s |
| Minimum Climb [15:23:19] |
-3.6 m/s |
| Units | |
| Speed | |
| Maximum Speed [14:40:35] |
62.2 km/h |
| Average Speed around course |
28.3 km/h |
| Average Speed over track length |
35.6 km/h |
| Units | |
| Tracklog | |
| Flight Duration | 1hr 56mins |
| Track Points | 684 |
| Recording Interval | 10 secs |
| Statistics Interval | 10 secs |
| Track Length | 69.0 km |
| Units | |
| Flight instrument | |
| Type | Flyskyhy |
| Model | 5.1 |
| Firmware | 5.1 |
| Height: | |
| Speed: | |
| Climb: | |
| Distance: |
| Main Map: |
| First Tab: |