


| Duration | 0:00 | Takeoff Distance | 0 |
| Height: | metres |
| Climb: | m/sec |
| Speed: | km/h |
| Distance: | km |
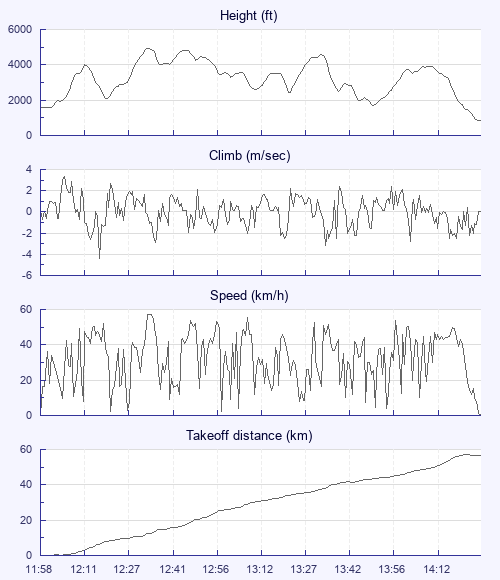
| Height - GPS data | |
| Maximum Height [12:34:59] |
4908 ft |
| Lowest Save [13:54:58] |
1703 ft |
| Takeoff Height [11:58:05] |
1522 ft |
| Landing Height [14:30:47] |
823 ft |
| Total Ascent | 13278 ft |
| Height Gain | |
| Above Takeoff | 3386 ft |
| Units | |
| Climb - Pressure data | |
| Maximum Climb [12:05:32] |
3.3 m/s |
| Minimum Climb [12:17:55] |
-4.4 m/s |
| Units | |
| Speed | |
| Maximum Speed [12:35:09] |
57.2 km/h |
| Average Speed around course |
23.7 km/h |
| Average Speed over track length |
31.5 km/h |
| Units | |
| Tracklog | |
| Flight Duration | 2hrs 32mins |
| Track Points | 915 |
| Recording Interval | 10 secs |
| Statistics Interval | 10 secs |
| Track Length | 80.2 km |
| Units | |
| Flight instrument | |
| Type | Brauniger |
| Model | Competino |
| Firmware | 1.21 |
| Height: | |
| Speed: | |
| Climb: | |
| Distance: |
| Main Map: |
| First Tab: |