


| Duration | 0:00 | Takeoff Distance | 0 |
| Height: | metres |
| Climb: | m/sec |
| Speed: | km/h |
| Distance: | km |
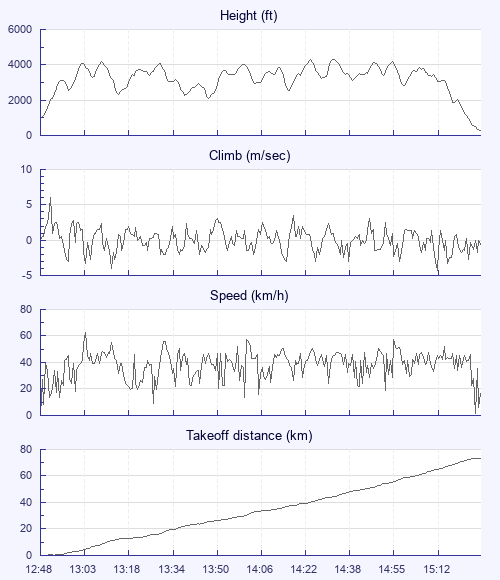
| Height - GPS data | |
| Maximum Height [14:35:21] |
4321 ft |
| Lowest Save [13:48:56] |
2103 ft |
| Takeoff Height [12:48:01] |
938 ft |
| Landing Height [15:28:28] |
285 ft |
| Total Ascent | 20978 ft |
| Height Gain | |
| Above Takeoff | 3383 ft |
| Units | |
| Climb - Pressure data | |
| Maximum Climb [12:51:04] |
6.0 m/s |
| Minimum Climb [15:14:41] |
-4.3 m/s |
| Units | |
| Speed | |
| Maximum Speed [13:03:44] |
63.0 km/h |
| Average Speed around course |
29.3 km/h |
| Average Speed over track length |
38.6 km/h |
| Units | |
| Tracklog | |
| Flight Duration | 2hrs 40mins |
| Track Points | 9624 |
| Recording Interval | 1 secs |
| Statistics Interval | 4 secs |
| Track Length | 103.1 km |
| Units | |
| Flight instrument | |
| Type | Flytec |
| Model | Connect 1 |
| Firmware | Buzzard-12.0.3-beta |
| Height: | |
| Speed: | |
| Climb: | |
| Distance: |
| Main Map: |
| First Tab: |