


| Duration | 0:00 | Takeoff Distance | 0 |
| Height: | metres |
| Climb: | m/sec |
| Speed: | km/h |
| Distance: | km |
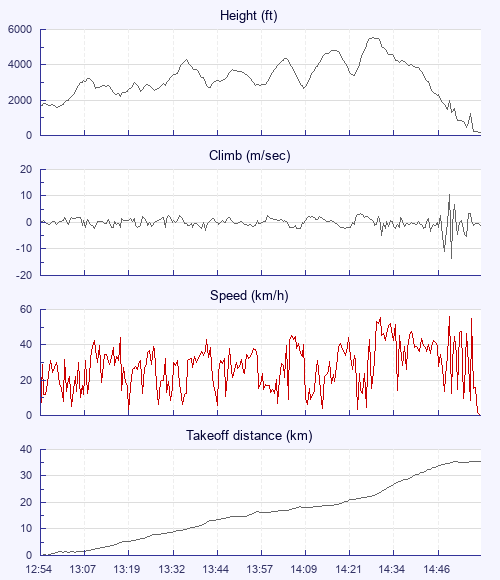
| Height - GPS data | |
| Maximum Height [14:30:20] |
5568 ft |
| Lowest Save [14:56:20] |
436 ft |
| Takeoff Height [12:54:50] |
1693 ft |
| Landing Height [14:59:36] |
157 ft |
| Total Ascent | 16483 ft |
| Height Gain | |
| Above Takeoff | 3875 ft |
| Maximum | 3999 ft |
| Low Point [12:59:50] |
1568 ft |
| High Point as Maximum Height |
5568 ft |
| Units | |
| Climb - GPS data | |
| Maximum Climb [14:52:05] |
10.5 m/s |
| Minimum Climb [14:52:20] |
-13.4 m/s |
| Units | |
| Speed | |
| Maximum Speed [14:52:05] |
55.9 km/h |
| Average Speed around course |
19.5 km/h |
| Average Speed over track length |
27.9 km/h |
| Units | |
| Tracklog | |
| Flight Duration | 2hrs 4mins |
| Track Points | 501 |
| Recording Interval | 15 secs |
| Statistics Interval | 15 secs |
| Track Length | 58.0 km |
| Invalid Positions [< 1%] |
2 |
| Units | |
| Flight instrument - reported as | |
| GPS 76 Software Version 2.20 |
| Height: | |
| Speed: | |
| Climb: | |
| Distance: |
| Main Map: |
| First Tab: |