


| Duration | 0:00 | Takeoff Distance | 0 |
| Height: | metres |
| Climb: | m/sec |
| Speed: | km/h |
| Distance: | km |
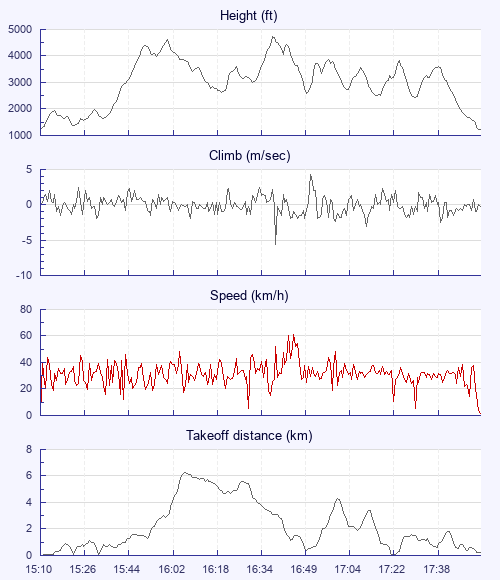
| Height - GPS data | |
| Maximum Height [16:40:09] |
4718 ft |
| Lowest Save [17:31:40] |
2434 ft |
| Takeoff Height [15:10:00] |
1230 ft |
| Landing Height [17:57:57] |
1227 ft |
| Total Ascent | 16798 ft |
| Height Gain | |
| Above Takeoff | 3488 ft |
| Units | |
| Climb - Pressure data | |
| Maximum Climb [16:52:17] |
4.3 m/s |
| Minimum Climb [16:40:41] |
-5.6 m/s |
| Units | |
| Speed | |
| Maximum Speed [16:47:17] |
61.2 km/h |
| Average Speed around course |
10.3 km/h |
| Average Speed over track length |
31.1 km/h |
| Units | |
| Tracklog | |
| Flight Duration | 2hrs 47mins |
| Track Points | 10078 |
| Recording Interval | 1 secs |
| Statistics Interval | 4 secs |
| Track Length | 87.1 km |
| Invalid Positions [< 1%] |
1 |
| Units | |
| Height: | |
| Speed: | |
| Climb: | |
| Distance: |
| Main Map: |
| First Tab: |