


| Duration | 0:00 | Takeoff Distance | 0 |
| Height: | metres |
| Climb: | m/sec |
| Speed: | km/h |
| Distance: | km |
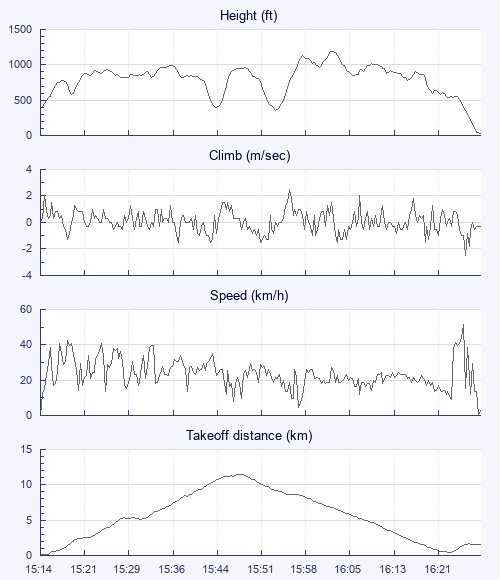
| Height - GPS data | |
| Maximum Height [16:03:13] |
1188 ft |
| Lowest Save [15:54:13] |
358 ft |
| Takeoff Height [15:14:37] |
387 ft |
| Landing Height [16:28:17] |
26 ft |
| Total Ascent | 3766 ft |
| Height Gain | |
| Above Takeoff | 801 ft |
| Maximum | 830 ft |
| Low Point as Lowest Save |
358 ft |
| High Point as Maximum Height |
1188 ft |
| Units | |
| Climb - Pressure data | |
| Maximum Climb [15:56:09] |
2.5 m/s |
| Minimum Climb [16:25:49] |
-2.5 m/s |
| Units | |
| Speed | |
| Maximum Speed [16:25:37] |
51.3 km/h |
| Average Speed around course |
19.9 km/h |
| Average Speed over track length |
23.5 km/h |
| Units | |
| Tracklog | |
| Flight Duration | 1hr 13mins |
| Track Points | 1106 |
| Recording Interval | 4 secs |
| Statistics Interval | 4 secs |
| Track Length | 28.9 km |
| Units | |
| Height: | |
| Speed: | |
| Climb: | |
| Distance: |
| Main Map: |
| First Tab: |