


| Duration | 0:00 | Takeoff Distance | 0 |
| Height: | metres |
| Climb: | m/sec |
| Speed: | km/h |
| Distance: | km |
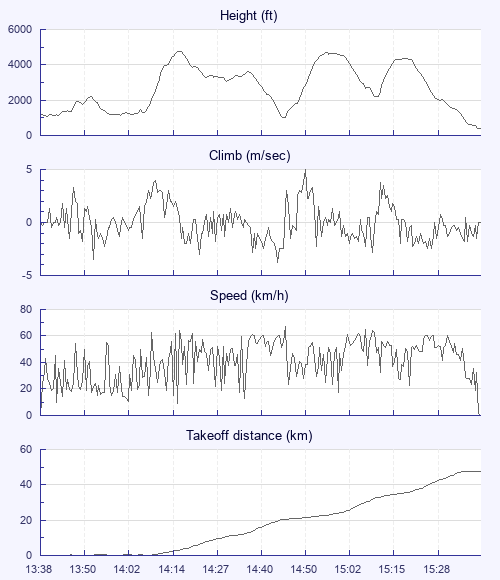
| Height - GPS data | |
| Maximum Height [14:16:57] |
4770 ft |
| Lowest Save [14:45:29] |
997 ft |
| Takeoff Height [13:38:41] |
1135 ft |
| Landing Height [15:40:27] |
377 ft |
| Total Ascent | 14072 ft |
| Height Gain | |
| Above Takeoff | 3635 ft |
| Maximum | 3730 ft |
| Low Point as Lowest Save |
997 ft |
| High Point [14:57:13] |
4728 ft |
| Units | |
| Climb - Pressure data | |
| Maximum Climb [14:50:53] |
5.0 m/s |
| Minimum Climb [14:44:25] |
-3.8 m/s |
| Units | |
| Speed | |
| Maximum Speed [14:45:33] |
67.5 km/h |
| Average Speed around course |
28.0 km/h |
| Average Speed over track length |
40.2 km/h |
| Units | |
| Tracklog | |
| Flight Duration | 2hrs 1min |
| Track Points | 1828 |
| Recording Interval | 4 secs |
| Statistics Interval | 4 secs |
| Track Length | 81.5 km |
| Units | |
| Flight instrument - reported as | |
| SKYTRAXX V1.59 SN:2012083971 |
| Height: | |
| Speed: | |
| Climb: | |
| Distance: |
| Main Map: |
| First Tab: |