


| Duration | 0:00 | Takeoff Distance | 0 |
| Height: | metres |
| Climb: | m/sec |
| Speed: | km/h |
| Distance: | km |
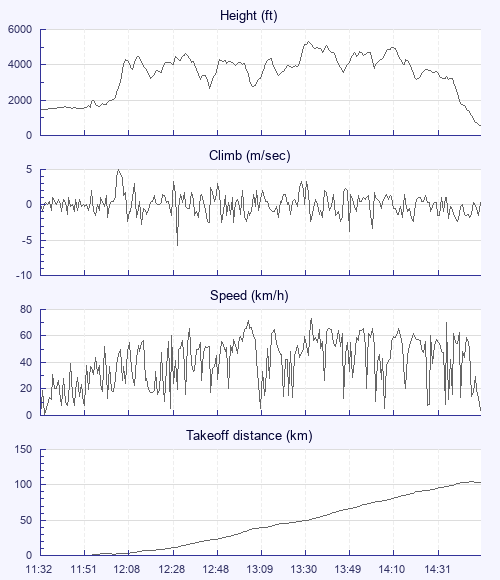
| Height - GPS data | |
| Maximum Height [13:35:54] |
5302 ft |
| Lowest Save [11:59:02] |
1644 ft |
| Takeoff Height [11:32:30] |
1440 ft |
| Landing Height [14:55:54] |
541 ft |
| Total Ascent | 20869 ft |
| Height Gain | |
| Above Takeoff | 3862 ft |
| Maximum | 3871 ft |
| Low Point [11:34:30] |
1430 ft |
| High Point as Maximum Height |
5302 ft |
| Units | |
| Climb - Pressure data | |
| Maximum Climb [12:04:58] |
5.0 m/s |
| Minimum Climb [12:32:34] |
-5.8 m/s |
| Units | |
| Speed | |
| Maximum Speed [13:36:38] |
72.9 km/h |
| Average Speed around course |
33.0 km/h |
| Average Speed over track length |
40.4 km/h |
| Units | |
| Tracklog | |
| Flight Duration | 3hrs 23mins |
| Track Points | 3052 |
| Recording Interval | 4 secs |
| Statistics Interval | 4 secs |
| Track Length | 137.0 km |
| Units | |
| Flight instrument - reported as | |
| 6015 |
| Height: | |
| Speed: | |
| Climb: | |
| Distance: |
| Main Map: |
| First Tab: |