


| Duration | 0:00 | Takeoff Distance | 0 |
| Height: | metres |
| Climb: | m/sec |
| Speed: | km/h |
| Distance: | km |
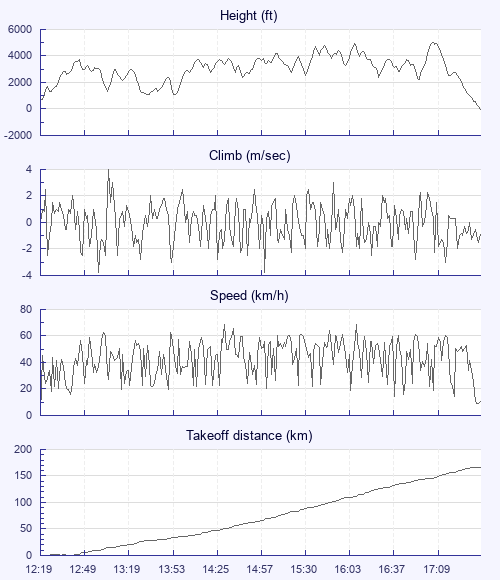
| Height - GPS data | |
| Maximum Height [17:08:17] |
5039 ft |
| Lowest Save [13:54:17] |
1066 ft |
| Takeoff Height [12:19:46] |
643 ft |
| Landing Height [17:39:30] |
-30 ft |
| Total Ascent | 35833 ft |
| Height Gain | |
| Above Takeoff | 4396 ft |
| Maximum | 4403 ft |
| Low Point [12:20:10] |
636 ft |
| High Point as Maximum Height |
5039 ft |
| Units | |
| Climb - Pressure data | |
| Maximum Climb [13:05:42] |
4.0 m/s |
| Minimum Climb [12:58:46] |
-3.8 m/s |
| Units | |
| Speed | |
| Maximum Speed [14:30:54] |
68.4 km/h |
| Average Speed around course |
33.4 km/h |
| Average Speed over track length |
42.9 km/h |
| Units | |
| Tracklog | |
| Flight Duration | 5hrs 19mins |
| Track Points | 19184 |
| Recording Interval | 1 secs |
| Statistics Interval | 4 secs |
| Track Length | 228.6 km |
| Units | |
| Flight instrument | |
| Type | Oudie 3 |
| Model | Not Set |
| Firmware | 6.15.001 |
| Height: | |
| Speed: | |
| Climb: | |
| Distance: |
| Main Map: |
| First Tab: |