


| Duration | 0:00 | Takeoff Distance | 0 |
| Height: | metres |
| Climb: | m/sec |
| Speed: | km/h |
| Distance: | km |
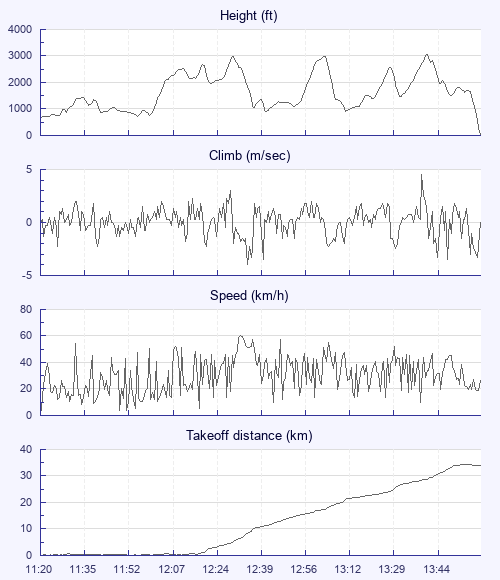
| Height - GPS data | |
| Maximum Height [13:44:02] |
3048 ft |
| Lowest Save [11:56:10] |
715 ft |
| Takeoff Height [11:20:30] |
650 ft |
| Landing Height [14:03:14] |
56 ft |
| Total Ascent | 14678 ft |
| Height Gain | |
| Above Takeoff | 2398 ft |
| Units | |
| Climb - Pressure data | |
| Maximum Climb [13:43:02] |
4.5 m/s |
| Minimum Climb [12:36:58] |
-4.0 m/s |
| Units | |
| Speed | |
| Maximum Speed [12:34:38] |
60.3 km/h |
| Average Speed around course |
15.7 km/h |
| Average Speed over track length |
30.0 km/h |
| Units | |
| Tracklog | |
| Flight Duration | 2hrs 42mins |
| Track Points | 2431 |
| Recording Interval | 4 secs |
| Statistics Interval | 4 secs |
| Track Length | 81.3 km |
| Units | |
| Flight instrument - reported as | |
| Flymaster F1, V1.5, S/N 425 |
| Height: | |
| Speed: | |
| Climb: | |
| Distance: |
| Main Map: |
| First Tab: |