Xc Title
User:Guest
Naviter advert
Mike Byfield  All flights
National League 2015
Flight type image
Turnpoint Flight on a Paraglider
Club
Thames Valley
Glider
Advance Omega 8
Date
23rd May 2015
Start
14:12
Finish
15:29
Duration
1hr 17mins
Takeoff
Combe Gibbet
Landing
Nr Test Valley District
Coords
Takeoff
51.35878, -1.47857
Start
51.35695, -1.49133
TP1
51.36057, -1.48257
TP2
51.19197, -1.45553
TP3
51.19562, -1.40100
Finish
51.18670, -1.40640
Landing
51.18782, -1.40735
Distances and Score
Leg 1
0.73k
Leg 2
18.85k
Leg 3
3.83k
Leg 4
1.06k
Total
24.47k
Score
24.5
Open Distance
Total
20.1k
Filename
Use full pilot name
Download
Validated
Yes
Flight map
Notes

This map gives an overview of the flight, using the turnpoints to plot the track.

Use the for a detailed map and flight track.

Duration 0:00   Takeoff Distance 0
Controls
To animate the flight: click a point on the track, use the slider, or click the Play button.
slider
slider
Speed
Speed
Slower
Faster
Track color
No data
Highlights
Track data
Time: No data
Height:
Climb:
Speed:
Interval:
Units
Height: metres
Climb: m/sec
Speed: km/h
Distance: km
chart
Notes

Climb and Speed averaged over 4 second intervals.

These values may be lower than those shown by a flight instrument, which has access to continuous raw data.

Metric units are used for all chart data, except for Height which is shown in feet.

Height   -   GPS data
Maximum Height
[14:37:54]
3753 ft
Lowest Save
[15:16:00]
1004 ft
Takeoff Height
[14:07:27]
925 ft
Landing Height
[15:30:57]
217 ft
Total Ascent 8944 ft
Height Gain
Above Takeoff 2828 ft
Maximum 2835 ft
Low Point
[14:07:35]
919 ft
High Point
as Maximum Height
3753 ft
Units
Climb   -   Pressure data
Maximum Climb
[14:35:07]
4.0 m/s
Minimum Climb
[14:44:07]
-3.5 m/s
Units
Speed
Maximum Speed
[14:45:55]
54.9 km/h
Average Speed
around course
19.0 km/h
Average Speed
over track length
34.4 km/h
Units
Tracklog
Flight Duration 1hr 23mins
Track Points 5011
Recording Interval 1 secs
Statistics Interval 4 secs
Track Length 47.9 km
Units
Flight instrument   -   reported as
Flymaster F1, V1.5, S/N 425
Notes

Climb and Speed averaged over 4 second intervals.

These values may be lower than those shown by a flight instrument, which has access to continuous raw data.

Average Speed around course is measured from Start to Finish points.

Track Length is the cumulative distance between track points from Takeoff to Landing.

You can change the default units displayed - see the Options page.

There were surprisingly few people at Combe, 10 or 12 pilots at most. The talk on the hill was of getting off the hill before the forecast easterly set in around 11 - that didn't happen! It stayed northerly to at least 2 ish.

One or two were skilled enough to escape the hill before noon, at which point there was a general 'time for lunch' cessation of flying (although one person did sneak away)

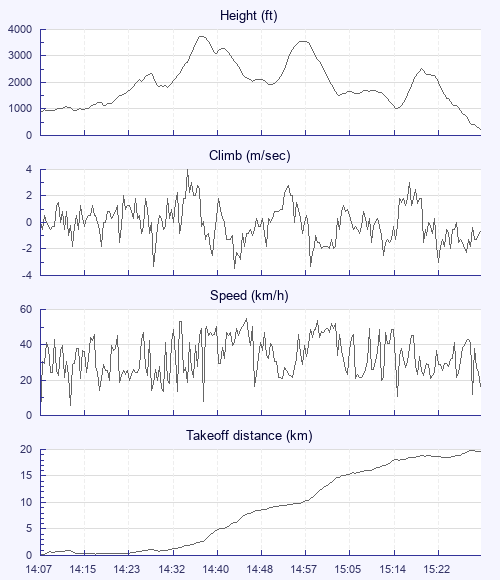
Once back in the air the climb out was the smoothest climb I'd been in all day (a silky 2 up). Once up, the next few climbs were fairly easy. The end of the flight was a bit of a bummer - V2 failure and vague idea of approaching airspace. Oh well, another lesson learnt!

Use this page to set various display Options. You can choose which units are used to display flight data, which map to show when the starts and which tab to show each time you view a flight.
Units settings

Metric units are used by default for the Statistics and XC Player pages, except for Height data which is shown in feet. You can choose your own custom settings here.

Height:
Speed:
Climb:
Distance:
  Use default
XC Player settings

When the XC Player starts, the track data is shown on the Hybrid map. You can choose a different map here.

Main Map:
  Use default
Tab settings

The first tab shown when you view a flight is the Flight Map. You can choose a different tab here.

First Tab:
  Use default
Notes

This page uses cookies to save your settings for future visits.

If you have disabled cookies for this site then any changes you make will not be saved.