


| Duration | 0:00 | Takeoff Distance | 0 |
| Height: | metres |
| Climb: | m/sec |
| Speed: | km/h |
| Distance: | km |
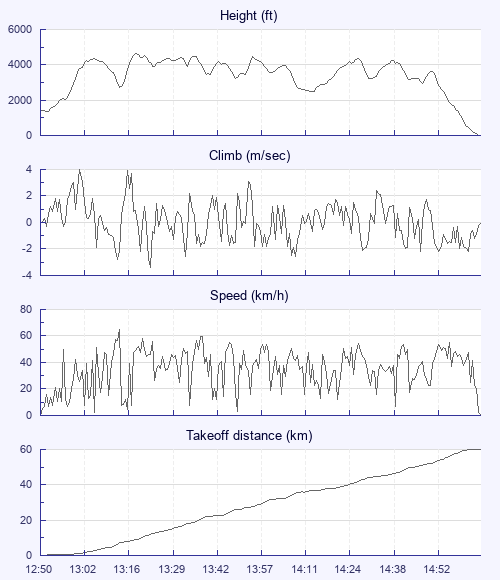
| Height - GPS data | |
| Maximum Height [13:19:18] |
4626 ft |
| Lowest Save [14:13:57] |
2467 ft |
| Takeoff Height [12:50:54] |
1375 ft |
| Landing Height [15:06:42] |
13 ft |
| Total Ascent | 14170 ft |
| Height Gain | |
| Above Takeoff | 3251 ft |
| Maximum | 3291 ft |
| Low Point [12:52:35] |
1335 ft |
| High Point as Maximum Height |
4626 ft |
| Units | |
| Climb - GPS data | |
| Maximum Climb [13:02:05] |
4.0 m/s |
| Minimum Climb [13:23:08] |
-3.4 m/s |
| Units | |
| Speed | |
| Maximum Speed [13:14:17] |
64.8 km/h |
| Average Speed around course |
27.9 km/h |
| Average Speed over track length |
34.9 km/h |
| Units | |
| Tracklog | |
| Flight Duration | 2hrs 15mins |
| Track Points | 813 |
| Recording Interval | 10 secs |
| Statistics Interval | 10 secs |
| Track Length | 79.1 km |
| Units | |
| Flight instrument - reported as | |
| GPSMAP 76S Software Version 4.00 |
| Height: | |
| Speed: | |
| Climb: | |
| Distance: |
| Main Map: |
| First Tab: |