


| Duration | 0:00 | Takeoff Distance | 0 |
| Height: | metres |
| Climb: | m/sec |
| Speed: | km/h |
| Distance: | km |
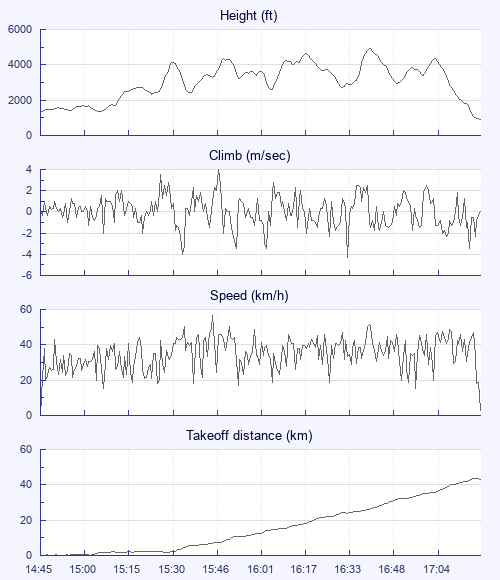
| Height - GPS data | |
| Maximum Height [16:43:02] |
4934 ft |
| Lowest Save [15:06:09] |
1345 ft |
| Takeoff Height [14:45:34] |
1289 ft |
| Landing Height [17:22:44] |
892 ft |
| Total Ascent | 13314 ft |
| Height Gain | |
| Above Takeoff | 3645 ft |
| Units | |
| Climb - Pressure data | |
| Maximum Climb [15:47:41] |
4.0 m/s |
| Minimum Climb [16:35:30] |
-4.3 m/s |
| Units | |
| Speed | |
| Maximum Speed [15:46:16] |
56.7 km/h |
| Average Speed around course |
20.2 km/h |
| Average Speed over track length |
34.9 km/h |
| Units | |
| Tracklog | |
| Flight Duration | 2hrs 37mins |
| Track Points | 2340 |
| Recording Interval | 4 secs |
| Statistics Interval | 4 secs |
| Track Length | 91.4 km |
| Units | |
| Flight instrument - reported as | |
| COMPETINO SN01447 SW1.21 |
| Height: | |
| Speed: | |
| Climb: | |
| Distance: |
| Main Map: |
| First Tab: |