


| Duration | 0:00 | Takeoff Distance | 0 |
| Height: | metres |
| Climb: | m/sec |
| Speed: | km/h |
| Distance: | km |
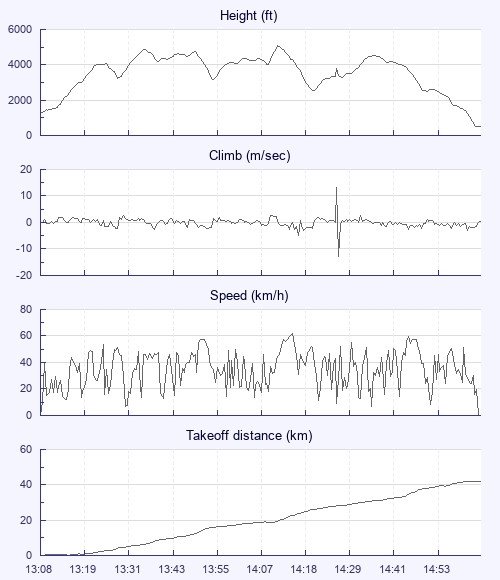
| Height - GPS data | |
| Maximum Height [14:11:49] |
5105 ft |
| Lowest Save [14:20:29] |
2523 ft |
| Takeoff Height [13:08:19] |
1329 ft |
| Landing Height [15:04:31] |
528 ft |
| Total Ascent | 11385 ft |
| Height Gain | |
| Above Takeoff | 3776 ft |
| Maximum | 3793 ft |
| Low Point [13:08:59] |
1312 ft |
| High Point as Maximum Height |
5105 ft |
| Units | |
| Climb - GPS data | |
| Maximum Climb [14:26:49] |
13.2 m/s |
| Minimum Climb [14:26:59] |
-12.7 m/s |
| Units | |
| Speed | |
| Maximum Speed [14:15:29] |
61.9 km/h |
| Average Speed around course |
23.1 km/h |
| Average Speed over track length |
34.5 km/h |
| Units | |
| Tracklog | |
| Flight Duration | 1hr 56mins |
| Track Points | 699 |
| Recording Interval | 10 secs |
| Statistics Interval | 10 secs |
| Track Length | 66.9 km |
| Units | |
| Flight instrument - reported as | |
| GPSMap76C Software Version 3.50 |
| Height: | |
| Speed: | |
| Climb: | |
| Distance: |
| Main Map: |
| First Tab: |