Xc Title
User:Guest
Ozone advert
Chris Smith  All flights
Long Mynd League 2010
Flight type image
Turnpoint Flight on a Paraglider
Club
Condors
Glider
Ozone Octane
Date
10th April 2010
Start
14:35
Finish
16:53
Duration
2hrs 18mins
Takeoff
Malvern Kettle Sings
Landing
Ross On Wye
Coords
Takeoff
52.07700, -2.33883
Start
52.08033, -2.33417
TP1
52.02583, -2.48567
TP2
52.01617, -2.47317
TP3
51.95150, -2.60750
Finish
51.91617, -2.58733
Landing
51.91650, -2.58767
Distances and Score
Leg 1
12.03k
Leg 2
1.38k
Leg 3
11.70k
Leg 4
4.17k
Total
29.28k
Score
29.3
Open Distance
Total
25.4k
Filename
Use full pilot name
Download
Validated
Yes
Flight map
Notes

This map gives an overview of the flight, using the turnpoints to plot the track.

Use the for a detailed map and flight track.

Duration 0:00   Takeoff Distance 0
Controls
To animate the flight: click a point on the track, use the slider, or click the Play button.
slider
slider
Speed
Speed
Slower
Faster
Track color
No data
Highlights
Track data
Time: No data
Height:
Climb:
Speed:
Interval:
Units
Height: metres
Climb: m/sec
Speed: km/h
Distance: km
chart
Notes

Climb and Speed averaged over 4 second intervals.

These values may be lower than those shown by a flight instrument, which has access to continuous raw data.

Red values indicate suspect data, because the tracklog contains invalid points.

Metric units are used for all chart data, except for Height which is shown in feet.

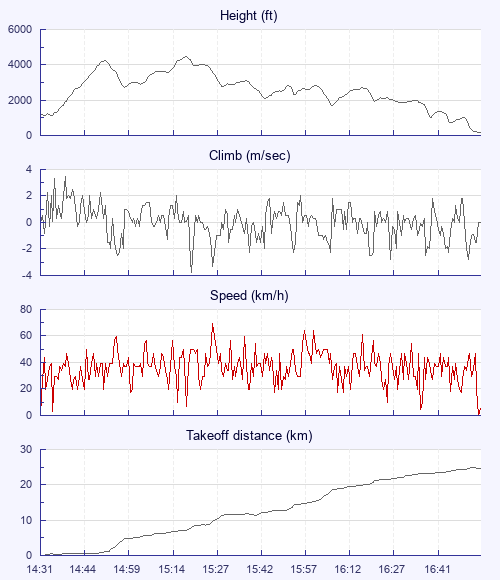
Height   -   Pressure data
Maximum Height
[15:18:59]
4455 ft
Lowest Save
[16:45:34]
725 ft
Takeoff Height
[14:31:29]
1125 ft
Landing Height
[16:54:09]
157 ft
Total Ascent 12310 ft
Height Gain
Above Takeoff 3330 ft
Maximum 3373 ft
Low Point
[14:34:56]
1083 ft
High Point
as Maximum Height
4455 ft
Units
Climb   -   Pressure data
Maximum Climb
[14:39:13]
3.5 m/s
Minimum Climb
[15:20:18]
-3.8 m/s
Units
Speed
Maximum Speed
[15:26:54]
69.3 km/h
Average Speed
around course
12.7 km/h
Average Speed
over track length
37.3 km/h
Units
Tracklog
Flight Duration 2hrs 22mins
Track Points 8561
Recording Interval 1 secs
Statistics Interval 4 secs
Track Length 88.6 km
Invalid Positions
[< 1%]
2
Units
Notes

Climb and Speed averaged over 4 second intervals.

These values may be lower than those shown by a flight instrument, which has access to continuous raw data.

Red values indicate suspect data, because the tracklog contains invalid points.

Average Speed around course is measured from Start to Finish points.

Track Length is the cumulative distance between track points from Takeoff to Landing.

You can change the default units displayed - see the Options page.

Use this page to set various display Options. You can choose which units are used to display flight data, which map to show when the starts and which tab to show each time you view a flight.
Units settings

Metric units are used by default for the Statistics and XC Player pages, except for Height data which is shown in feet. You can choose your own custom settings here.

Height:
Speed:
Climb:
Distance:
  Use default
XC Player settings

When the XC Player starts, the track data is shown on the Hybrid map. You can choose a different map here.

Main Map:
  Use default
Tab settings

The first tab shown when you view a flight is the Flight Map. You can choose a different tab here.

First Tab:
  Use default
Notes

This page uses cookies to save your settings for future visits.

If you have disabled cookies for this site then any changes you make will not be saved.